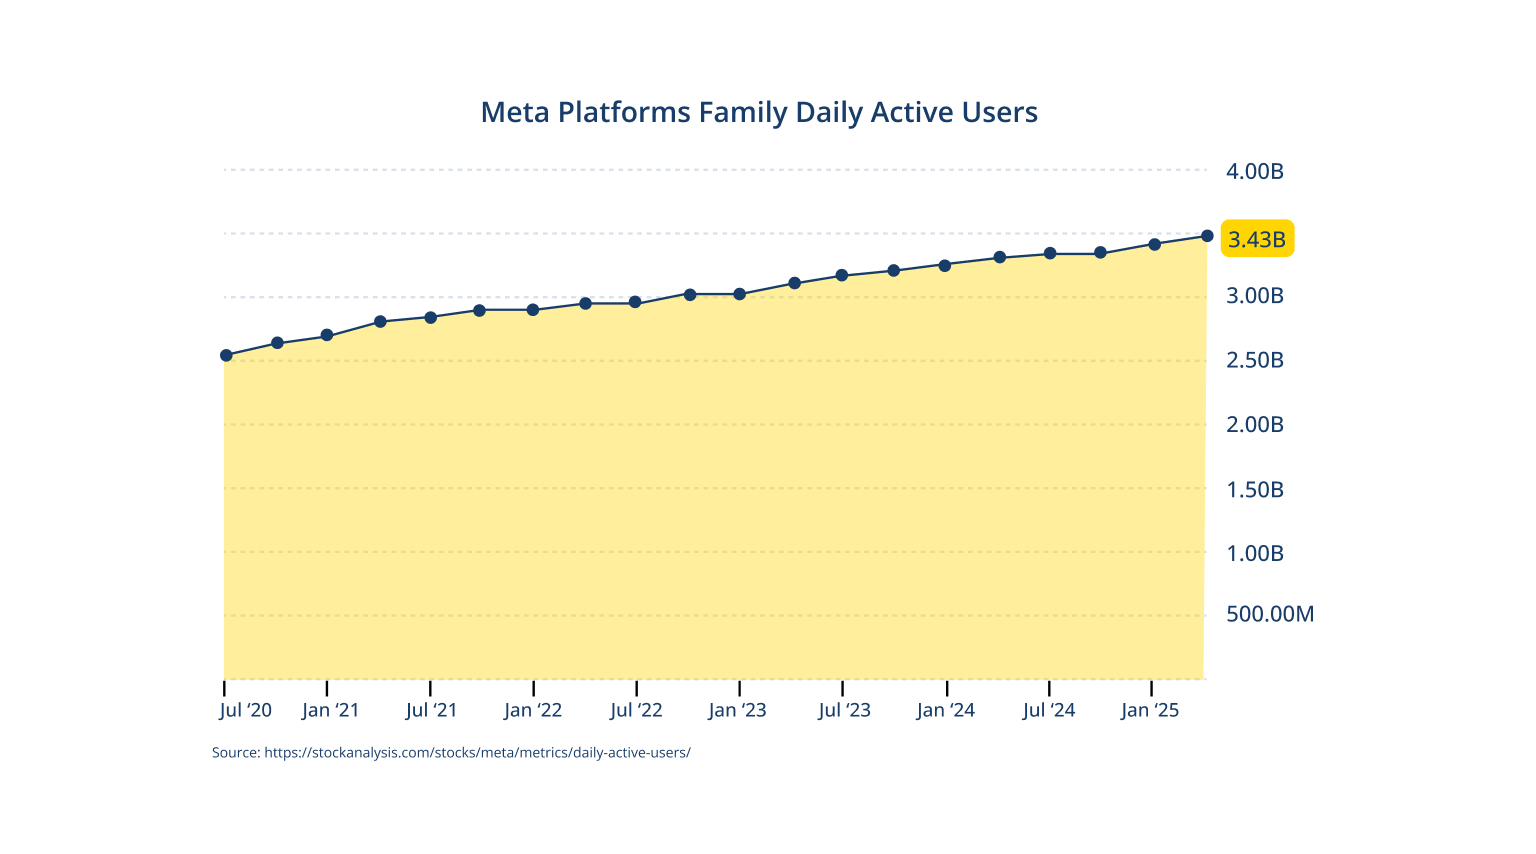
“In Q1 2025, Meta’s family of apps reached an astonishing 3.43 billion monthly active users—yet many small businesses still focus almost exclusively on Google Ads.” According to a July 2024 analysis of over 3,000 Facebook/Meta ad accounts by Intensify, the average Meta Ads ROAS was 2.98× per dollar spent, and a separate Meta-commissioned study reported U.S. advertisers achieved 3.71× ROAS in early 2024. If you’re pouring all your budget into search, you’re missing out on the rich audience targeting, lower CPCs, and high-intent retargeting that Meta can deliver alongside Google. Understanding advertising costs and developing a robust advertising strategy are crucial for maximizing the effectiveness of your campaigns. Additionally, when creating ads on Meta platforms, it is essential to configure billing options and add payment methods to ensure smooth operation.
Introduction to Meta Ads
Meta Ads, formerly known as Facebook Ads, is a powerful advertising platform that allows businesses to reach their target audience and achieve their marketing goals. With over 3 billion monthly active users, Meta Ads provides an unparalleled opportunity for businesses to increase brand awareness, drive website traffic, and generate leads. The platform offers a range of ad formats, including image, video, carousel, and collection ads, allowing businesses to choose the best format to showcase their products or services. By leveraging Meta Ads, businesses can create targeted ad campaigns that reach their ideal customer, drive conversions, and ultimately increase revenue.
What You’ll Learn
Before diving in, here’s a snapshot of the key takeaways you’ll get from this article:
- How to leverage Meta Ads alongside Google for expanded reach, precise targeting, and cost-efficiency.
- Why industry-specific Facebook Ads benchmarks are crucial for diagnosing performance gaps and setting realistic goals.
- Definitions of essential Ads metrics—CTR, CPC, CVR, CPA (Cost per Result), and ROAS—and how to interpret them in relation to key performance indicators.
- Real-world budget insights, including median monthly spend by industry, to align expectations with typical small-business investment.
- Detailed benchmarks for both Lead Generation and Traffic campaigns across top verticals, helping you pinpoint where you stand.
- Actionable strategies to gain insights by encouraging data-sharing groups and using custom labels to refine ad approaches, optimize campaigns, and improve targeting and cost efficiency.
- Industry-specific playbooks for sectors like e-commerce, legal, healthcare, education, and real estate.
- A clear, step-by-step call to action for auditing and optimizing your own Meta campaigns to maximize ROI.
Why Lean on Meta Ads?
Meta’s advertising platforms stand out for one simple reason: reach. With over 3.43 billion people logging into Facebook, Instagram, WhatsApp, and Threads every month, you gain access to highly granular demographic and interest data that search engines simply can’t match. According to the 2024 Small Business Marketing Report by VistaPrint in partnership with Wix, 54% of consumers discover small businesses via social media, while 44% find them through search engines, underscoring how Meta’s reach and precision can turbocharge your campaigns.
Beyond sheer audience size, Meta excels in cost efficiency. Lead-generation campaigns on Meta average just $1.88 per click, roughly 60% less than the $4.66 CPC you’ll typically pay on Google Ads, according to WordStream’s latest benchmarks. That means you can drive more inquiries, demo sign-ups, or ebook downloads for every dollar spent, freeing up budget to test new creatives, experiment with different ad placements, or scale winning audiences.
Perhaps most importantly, Meta thrives at both social discovery and retargeting. Many customers don’t begin their purchase journey with a direct search; they stumble upon brands through organic social scrolling. Meta’s dynamic ad formats surface relevant products and offers based on a user’s past behavior, then follow up with lookalike audiences that mirror your best customers. Additionally, Facebook’s algorithm plays a crucial role in optimizing ad delivery, ensuring your ads reach the most relevant audiences. This blend of top-of-funnel awareness and high-intent retargeting complements Google Ads perfectly, ensuring you capture demand at every stage of the funnel.
Now that you know why Meta Ads deserve a spot in your media mix, the next question is – how do you know if your campaigns are truly performing? Data shows that using benchmarks can provide valuable insights into your campaign’s effectiveness. That’s where benchmarks come in.
Why Meta Ads Benchmarks Matter
According to a recent Forbes report, 73% of small business owners aren’t confident their current marketing strategy supports their goals, with many struggling to know which channels to prioritize and how to improve campaign performance.
Benchmarks can cut through that uncertainty by giving you clear, industry-specific targets to aim for. Benchmarks are your compass when every ad dollar counts. They shine a light on where your campaigns fall short against industry peers and signal exactly what needs tweaking. Remember, benchmarks aren’t static—they ebb and flow with seasonality, ad competition, and consumer trends, so use them as flexible guideposts rather than rigid rules. Armed with these targets, you can set bold yet attainable goals anchored in real-world data. Forecasting leads, sales, and revenue shifts from guesswork to strategic planning, ensuring each dollar directly contributes to your bottom line. And when it’s time to present results, benchmarks give you an arsenal of objective metrics, transforming subjective opinions into clear, data-driven insights. Although these industry averages are meant as starting points (not hard targets), real-world CPCs, CTRs, and ROAS will still shift based on your region, seasonality, campaign objective, ad quality, and audience nuances. Always validate with small-scale tests, track your own data over time, and adjust your goals each quarter rather than assuming these numbers translate perfectly to your business. Monitoring the average cost per click is crucial to ensure your ad spend is optimized and your campaigns are performing efficiently.
Key Meta Ads Metrics Defined
Having established why benchmarks matter, let’s dive straight into the core metrics that define Meta Ads performance:
Click-Through Rate (CTR): CTR measures the percentage of users who clicked on your ad after seeing it (Clicks ÷ Impressions × 100). It’s a direct indicator of how well your creative and messaging resonate. A low CTR (below 0.5%) usually signals weak targeting or uninspiring visuals, while a strong CTR (1.5%+) often accompanies highly relevant offers and compelling calls-to-action.
Cost per Click (CPC): CPC represents the average amount you pay each time someone clicks your ad (Total Spend ÷ Total Clicks). A lower CPC indicates efficient spend and allows you to attract more traffic with the same budget. If your CPC runs higher than industry norms, it doesn’t always look bad on paper—especially in sectors with longer sales cycles or higher lifetime values, like legal or B2B services. In those cases, paying a premium CPC can mean you’re reaching a more qualified audience with stronger purchase intent. In short, a higher CPC isn’t a sign that Meta lead ads aren’t working; it may reflect the value of the clicks you’re getting. Consider CPC alongside related metrics (CVR, CPA, ROAS) and business context before deciding it’s too high. When comparing Facebook ads to other platforms, their precise targeting capabilities often result in a better ROI, making them a preferred choice for many advertisers.
Conversion Rate (CVR): CVR measures the percentage of clicks that lead to your desired action—like a form submission, sign-up, or purchase (Conversions ÷ Clicks × 100). A healthy CVR indicates your landing page and offer resonate; if it falls below 2% for e-commerce or 5% for lead generation, it’s a red flag that your messaging or page experience needs refining.
Cost per Action (CPA): CPA calculates how much you spend for each conversion (Total Spend ÷ Total Conversions). This ties ad spend directly to tangible outcomes, letting you see how much you pay for each lead or sale. Meta calls this metric “Cost per Result” in Ads Manager, but CPA remains a useful shorthand. Effective facebook advertising campaigns often leverage tools like Facebook Ad Cost Calculators to estimate expenses and potential returns, aiding in better financial planning and strategic decision-making.
Return on Ad Spend (ROAS): ROAS shows how much revenue you earn per dollar spent on ads (Total Revenue ÷ Total Ad Spend). A ROAS of 3× means you earn $3 for every $1 invested. Aim for a ROAS that not only covers costs and profit margins but also fuels long-term growth.
What Do Businesses Really Spend on Meta Ads?
Understanding ad performance is only part of the picture—budget matters too. According to AgencyAnalytics, the typical monthly ad spending for Facebook Ads across industries is $787.43. While some clients invest over $8,000 a month, this is the exception, not the norm.
In reality, 50% of campaigns fall within the $500 to $2,000 range, which aligns closely with small to mid-sized business budgets. The average CPM, representing the cost per thousand impressions, is around $7.19. This reinforces a key point: success on Meta doesn’t always require enterprise-level spend—it requires smart targeting, compelling creatives, and consistent optimization.
Below is the median monthly ad spend by industry. Notice higher budgets in sectors like Agriculture & Farming ($2,900)—likely due to seasonal timing or the need to reach niche audiences across large geographic areas—while verticals like Plumbing, Landscaping, and Real Estate often operate with much leaner budgets, under $600. The importance of testing and refining different ad creatives, headlines, and formats cannot be overstated, as it enhances ad quality and achieves better results in terms of cost per click (CPC) and return on investment (ROI).
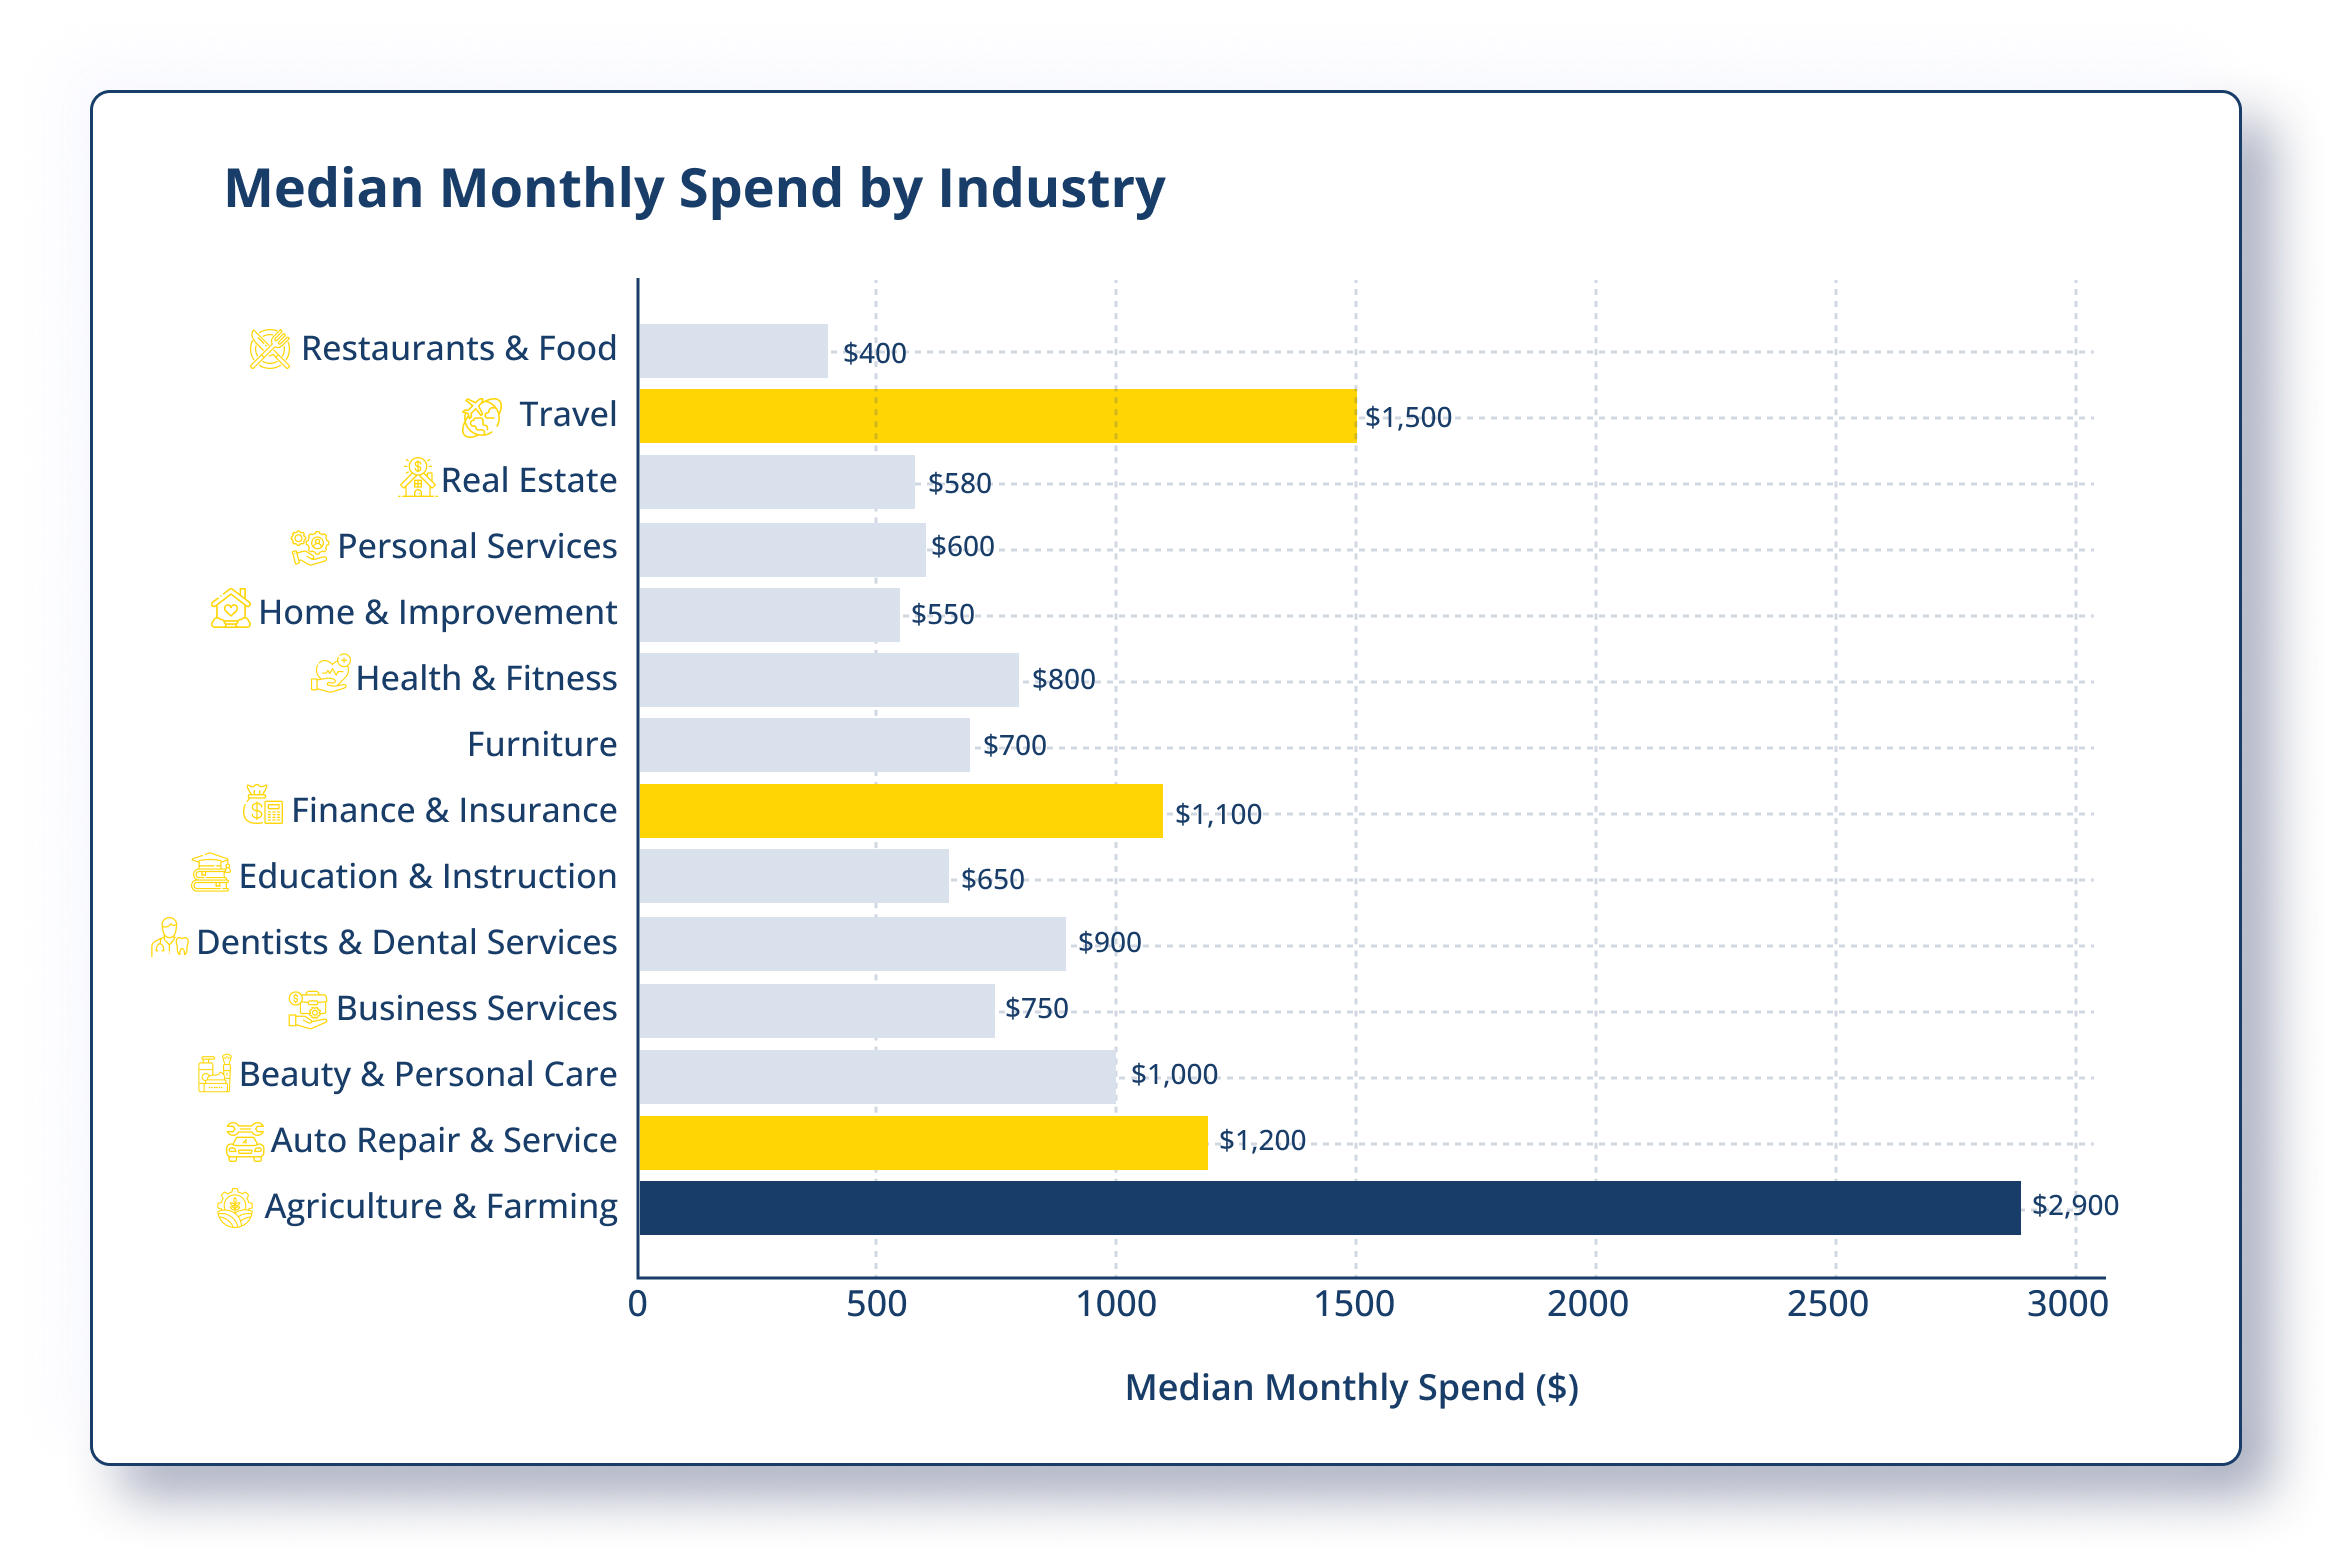
Sources: AgencyAnalytics, Facebook advertising,“Facebook Ads Benchmarks To Keep On Your Agency’s Radar in 2025”
Ad Costs and Average Conversion Rate
The cost of Meta Ads varies depending on several factors, including the target audience, ad format, and bidding strategy. On average, the cost per click (CPC) for Meta Ads is around $0.70, while the average conversion rate is around 9%. However, these numbers can vary significantly depending on the industry and target audience. For example, the average CPC for the finance industry is around $3.00, while the average conversion rate is around 5%. In contrast, the average CPC for the e-commerce industry is around $0.50, while the average conversion rate is around 12%. Understanding these benchmarks is crucial for businesses to optimize their ad campaigns and achieve their marketing goals.
Meta Ads Benchmarks by Industry
Below, you’ll find key benchmarks for both Lead Generation and Traffic campaigns across top small-business industries. Reviewing these side by side will help you identify which verticals excel in driving demand versus awareness. Aligning ad formats and strategies with specific campaign objectives is crucial to optimize results. Different ad types, such as those used on Facebook, TikTok, Pinterest, LinkedIn, and Instagram, offer unique advantages in terms of reach and targeting capabilities, impacting key performance metrics for advertisers.
Lead Generation Campaigns
Lead generation campaigns typically focus on high-intent actions—form fills, demo requests, or quote inquiries. Notice how industries with higher customer lifetime values (like Legal or B2B) often tolerate higher CPCs and CPLs in exchange for quality leads. Understanding facebook ad costs is crucial, as factors like geographic location, seasonal fluctuations, campaign objectives, and industry competitiveness can significantly influence pricing.
In the big picture, the stability of Facebook ads contrasts with the challenges faced by search ads, highlighting the shifting consumer behavior towards social media. This broader dynamic is essential for effective advertising strategies, emphasizing the importance of understanding overarching trends in advertising performance.
Sources: LocaliQ, “Facebook Advertising Benchmarks for 2024” (localiq.com)
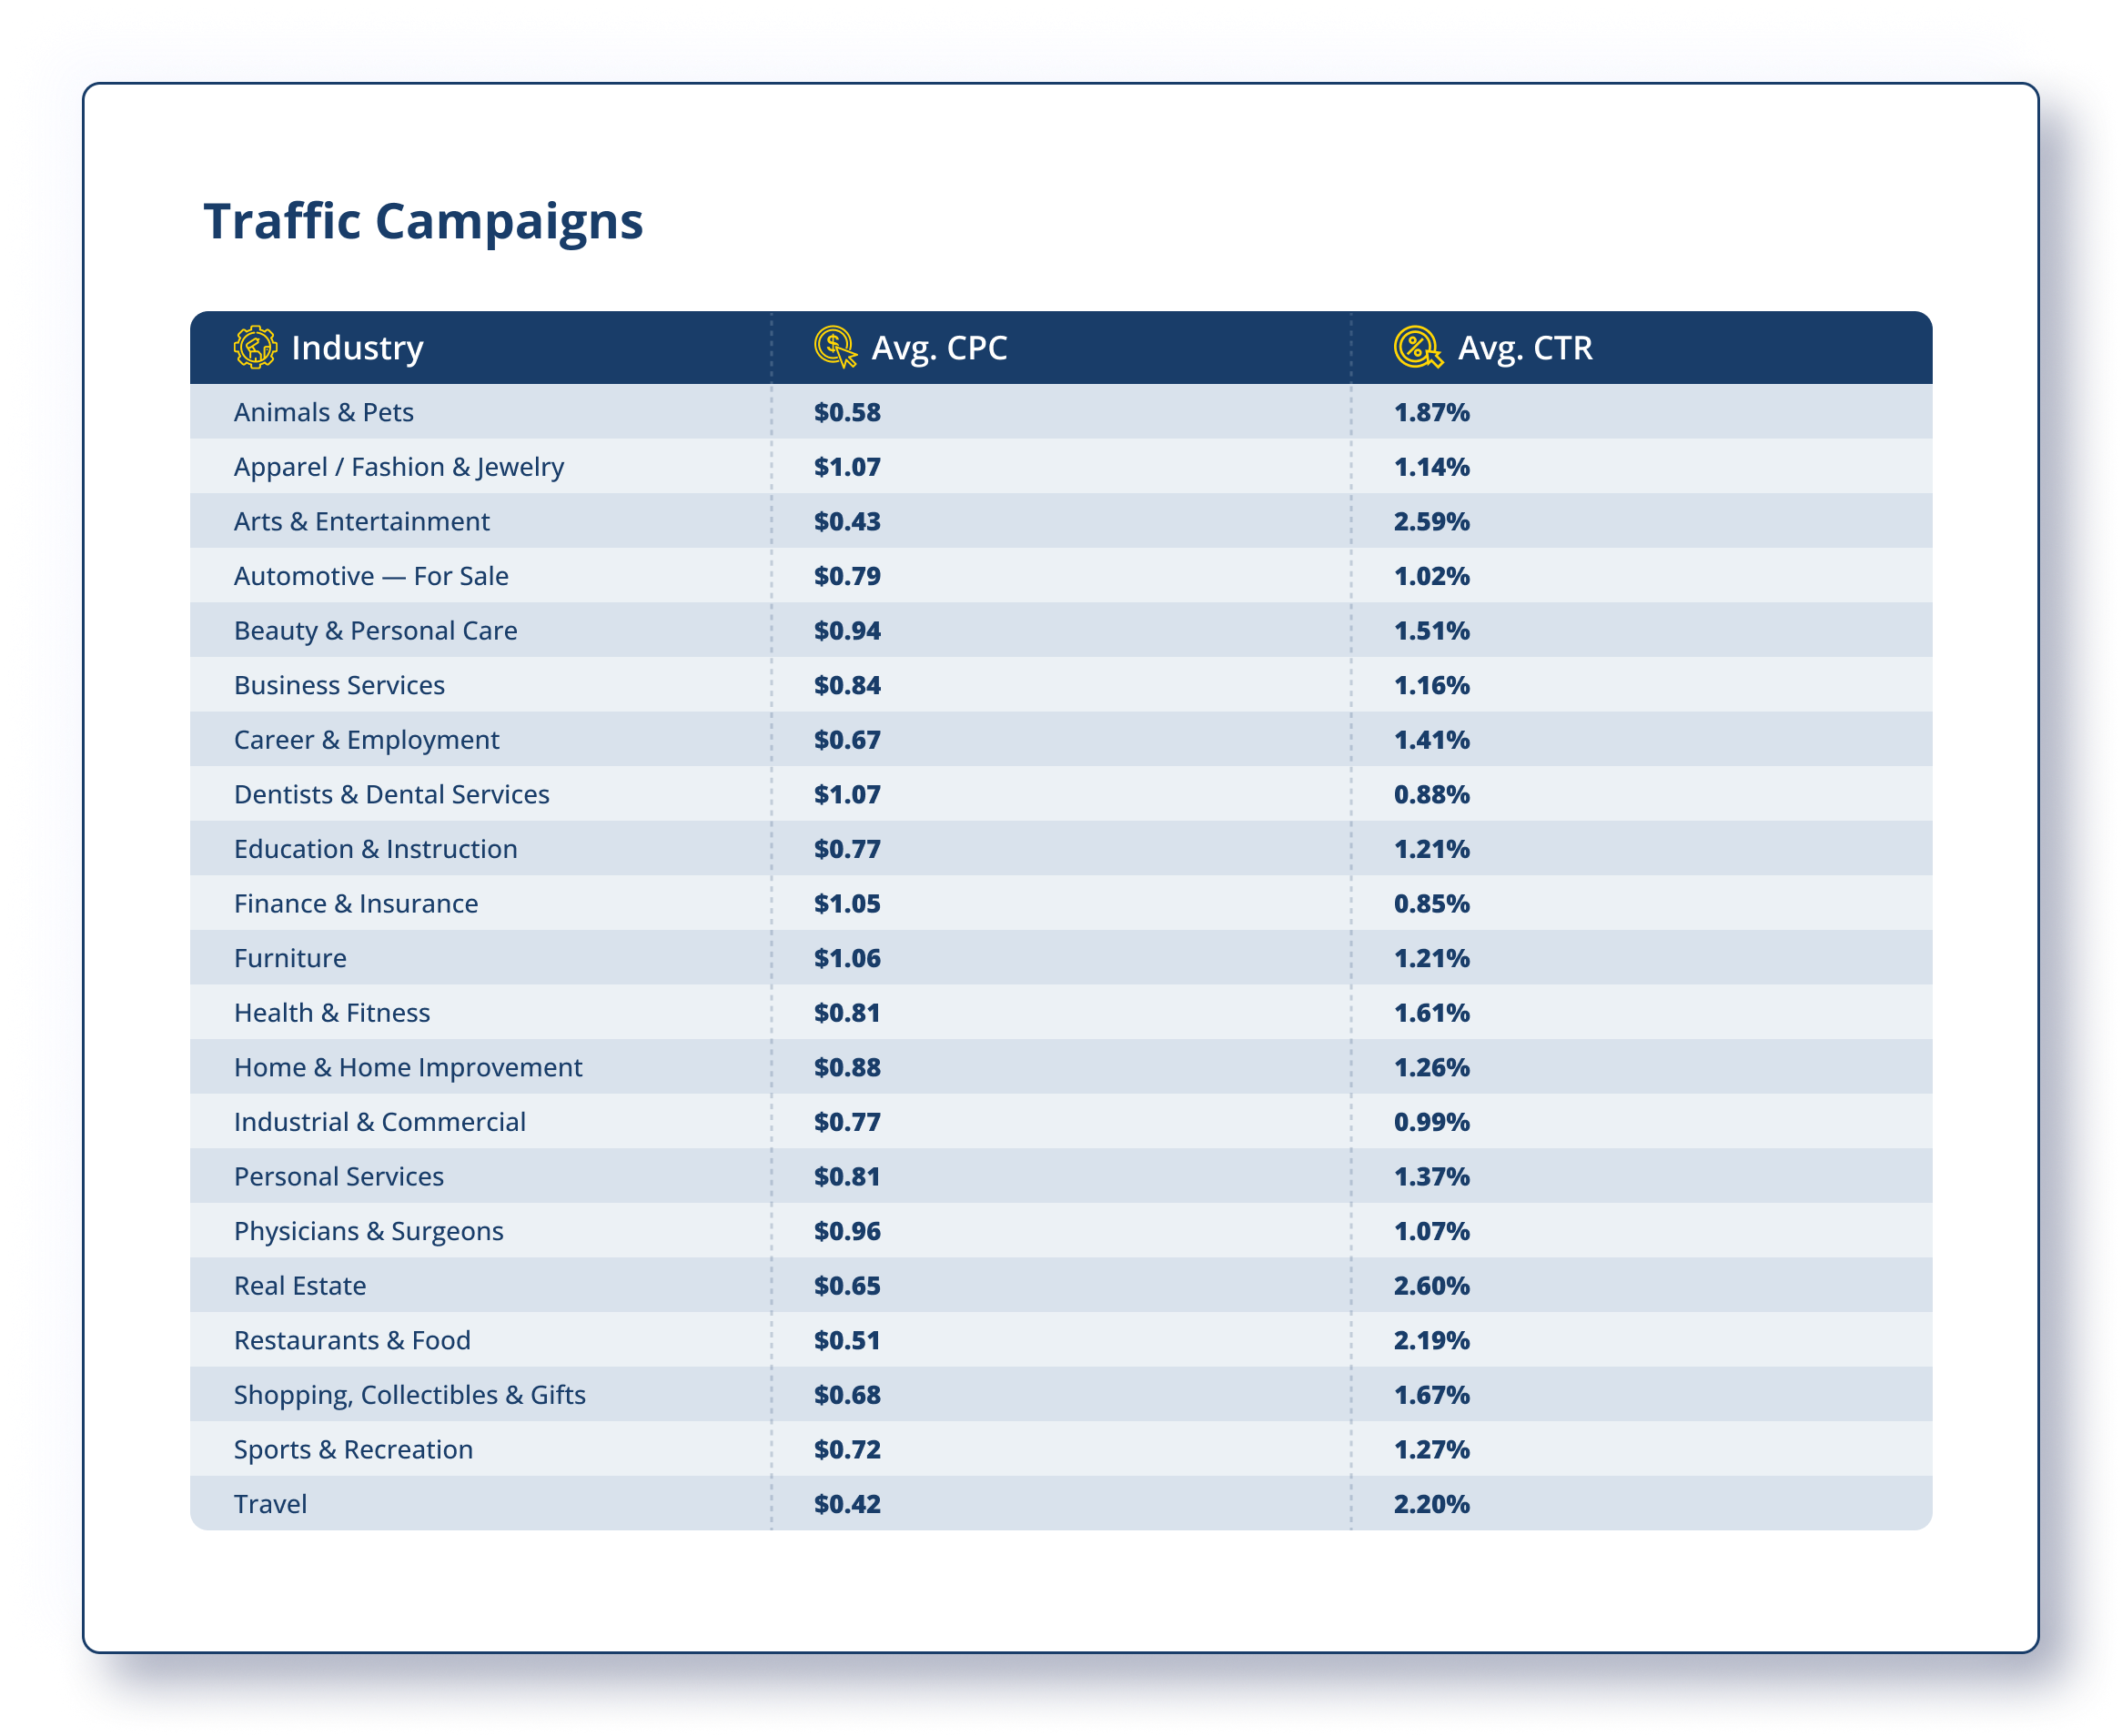
Traffic campaigns are ideal for awareness and top-of-funnel engagement, where lower CPCs and higher CTRs indicate strong creative resonance. Compare these rates against your own to see which industries excel at driving clicks versus generating leads. Traffic campaigns focus strictly on driving visits, so metrics like Cost per Lead (CPL) and Conversion Rate (CVR) aren’t tracked here—those belong to lead-gen or conversion-focused objectives. Tracking key metrics is essential to understand the effectiveness of your campaigns and optimize for better performance.
Achieving a lower cost in traffic campaigns is crucial for maximizing your advertising budget and improving overall campaign efficiency.
Remember, these metrics reflect different objectives (demand vs. awareness), so always consider your campaign’s goal and business context before drawing conclusions.
Sources: LocaliQ, “Facebook Advertising Benchmarks for 2024” (localiq.com)
Audience Targeting and Average CPC
Audience targeting is a critical component of Meta Ads, allowing businesses to reach their ideal customer and increase the effectiveness of their ad campaigns. Meta Ads provides a range of targeting options, including demographic, interest, and behavioral targeting. By leveraging these targeting options, businesses can create ad campaigns that are tailored to their target audience and increase the likelihood of conversion. The average CPC for Meta Ads varies depending on the target audience and ad format, but businesses can expect to pay around $0.70 per click. However, this number can vary significantly depending on the industry and target audience, and businesses should monitor their ad campaigns closely to ensure they are achieving their marketing goals.
Meta Ads Benchmarks Small Businesses: Insights
When looking at benchmark tables for Meta advertising, it’s easy to get lost in the numbers, but interpreting them with context—especially for small businesses and marketers—is what turns raw data into actionable insight.
For example, certain industries like travel, arts & entertainment, and real estate consistently show low cost-per-click (CPC) figures paired with relatively high click-through rates (CTR). This suggests that businesses in these sectors can drive a significant amount of traffic without spending heavily. For small businesses looking to build awareness or increase site visits, traffic campaigns in these industries offer a cost-effective entry point into Meta advertising. Additionally, understanding the average cost per click and average cost per impression in these sectors can help businesses budget more effectively and set realistic expectations for their campaigns.
On the other hand, lead generation campaigns show a different story. Industries such as real estate, personal services, and business services demonstrate low cost-per-lead (CPL) along with high conversion rates (CVR). These results reflect strong opportunities for lead acquisition, particularly where the user journey is straightforward—like filling out a form or booking a consultation. For marketers, this indicates that properly optimized campaigns in these sectors can deliver not just volume, but quality leads at scale. Key insights from these metrics can help small businesses optimize their advertising strategies and improve their return on investment.
In contrast, sectors like legal services or automotive repair tend to face higher CPCs and CPLs. This is often due to high competition and the nature of high-value services that require more trust and time before conversion. That doesn’t mean Meta ads aren’t effective in these spaces—but it does mean strategy matters more. Tighter audience targeting, more refined messaging, and conversion-optimized landing pages become essential to justify the higher acquisition costs.
It’s also important to remember that the type of campaign objective directly influences which metrics are relevant. Traffic campaigns are built to drive clicks and website visits, not conversions, so benchmarks like CPL or CVR typically aren’t available or meaningful. Conversely, lead generation campaigns—especially those using Meta’s built-in forms—are specifically designed to capture leads, making those metrics more reliable and informative.
In short, benchmarks aren’t universal truths. They reflect patterns, but real results depend heavily on your audience, offer, creative, and campaign structure. For both small business owners and marketers, the value lies in using these benchmarks as a reference point—not a rulebook—and then testing and refining campaigns based on real performance data.
How to Use These Benchmarks
Benchmark data is only valuable if you know how to apply it to your own campaigns. Whether you’re managing ads for a small local business or scaling efforts for a client, these numbers should serve as reference points, not performance goals set in stone. In this evolving digital landscape, Facebook advertising continues to be a key ad strategy for marketers. Understanding campaign performance metrics and industry benchmarks for Facebook ads is essential for optimizing campaigns and achieving a better return on investment.
Start by comparing your current metrics—CPC, CTR, CPL, CVR—to the industry averages shown here. If your results are significantly above or below the benchmark, don’t panic. Instead, ask why. Are your creatives resonating with the audience? Is your targeting too broad—or too narrow? Are you using the right campaign objective for your actual goal? Effective paid ad targeting can lower costs per click (CPC) and improve the effectiveness of your ad campaigns by narrowing the audience to those more likely to engage with the ads.
If your cost per lead is much higher than average, for example, it might not mean your campaign is failing. It could mean your leads are of higher quality, or your conversion process is more complex and requires warmer traffic. On the flip side, if your CPC is low but your CVR is poor, it may be time to look at the landing page experience or lead form design.
For those just starting out, benchmarks are helpful for setting expectations and budgeting. If your industry averages $40 per lead, you can use that to estimate how many leads you might generate from a $400 ad spend. It’s not exact—but it’s better than guessing.
Ultimately, use industry benchmarks as a baseline to identify where you’re outperforming, underperforming, or simply experimenting. The most valuable insights will always come from your own data over time, but these numbers give you a solid place to begin measuring, iterating, and improving.
What to Do When You’re Above or Below Benchmark
Once you’ve compared your campaign results to the industry benchmarks, the next step is knowing how to respond. Being above or below the average isn’t inherently good or bad—it’s simply a signal to analyze what’s driving your performance and how to improve it. Evaluating your facebook ad performance against industry standards can help identify areas for improvement and optimize your approach to increase return on investment.
If your metrics are better than benchmark, you’re on the right track. For instance, a local real estate agency might see a cost per lead (CPL) of $10 when the industry average is around $14. This could mean your targeting is highly effective, your offer is clear (e.g., “Get a Free Home Valuation”), or your lead form is well-optimized. In this case, consider gradually increasing your budget or testing slight variations of your top-performing ad to expand your reach without sacrificing performance.
If your results are below benchmark, don’t immediately assume your campaign is failing—context matters. Let’s say a personal trainer is running a traffic campaign and sees a click-through rate (CTR) of 0.9%, while the health & fitness benchmark is around 1.6%. This might indicate your ad creative isn’t catching attention. Updating the visuals to feature real client transformations, adding urgency to your call-to-action, or refining your headline could lift your engagement. Similarly, if a dental clinic sees a CPL of $60 (well above the $32 average), the issue might lie in the lead form experience or landing page—not the ad itself. Managing your advertising budget effectively is crucial in such scenarios to ensure resources are allocated optimally and realistic expectations are set.
In highly competitive industries like legal services, even benchmark-level CPLs can look high. For example, $100 per lead may seem excessive, but if those leads convert into high-value clients, the return on ad spend (ROAS) can still be strong. In such cases, track lead quality, not just volume or cost.
Whether you’re outperforming or falling short, use the benchmarks to form a hypothesis: Is my creative doing its job? Am I targeting the right audience? Is the conversion path smooth? Small, strategic adjustments—such as testing different ad copy, refining your call-to-action, or improving the landing page experience—can turn underperforming campaigns into efficient lead machines.
Conclusion & Next Steps
Final Thoughts
Benchmarks offer a valuable lens for evaluating your Meta ad performance, but they’re just one part of the bigger picture. Whether your campaigns are performing above or below average, what matters most is how you respond—by testing, optimizing, and adapting your strategy to meet your unique goals and attract new customers.
Don’t treat benchmarks as strict standards to chase. Instead, use them as a reference point to make smarter decisions, set realistic expectations, and uncover areas of opportunity. The real power lies in how you apply this insight to improve results over time. The Facebook Pixel plays a crucial role in this process by enabling precise conversion tracking and measuring how online ads drive offline sales.
As the advertising landscape continues to evolve, staying informed and adaptable is key. Track your metrics closely, test intentionally, and let performance—not guesswork—guide your growth.
Ready to put your benchmarks to work?Start by reviewing your latest Meta campaign results side by side with the benchmarks shared in this article. Need help interpreting the data or planning your next move? Whether you’re running ads for your own business or managing them for clients, a fresh perspective can make all the difference.
Contact us for a quick ad performance audit, or subscribe to our newsletter for ongoing insights, strategies, and updates on what’s working right now in Meta advertising. If you’re also considering working with a Google Partner agency, learn why it can benefit your
Recommended Articles

This Month's Strategy Can Define Your Year - Don't Miss Out!

4.9 stars from 43 entrepreneurs

 416-460-1810