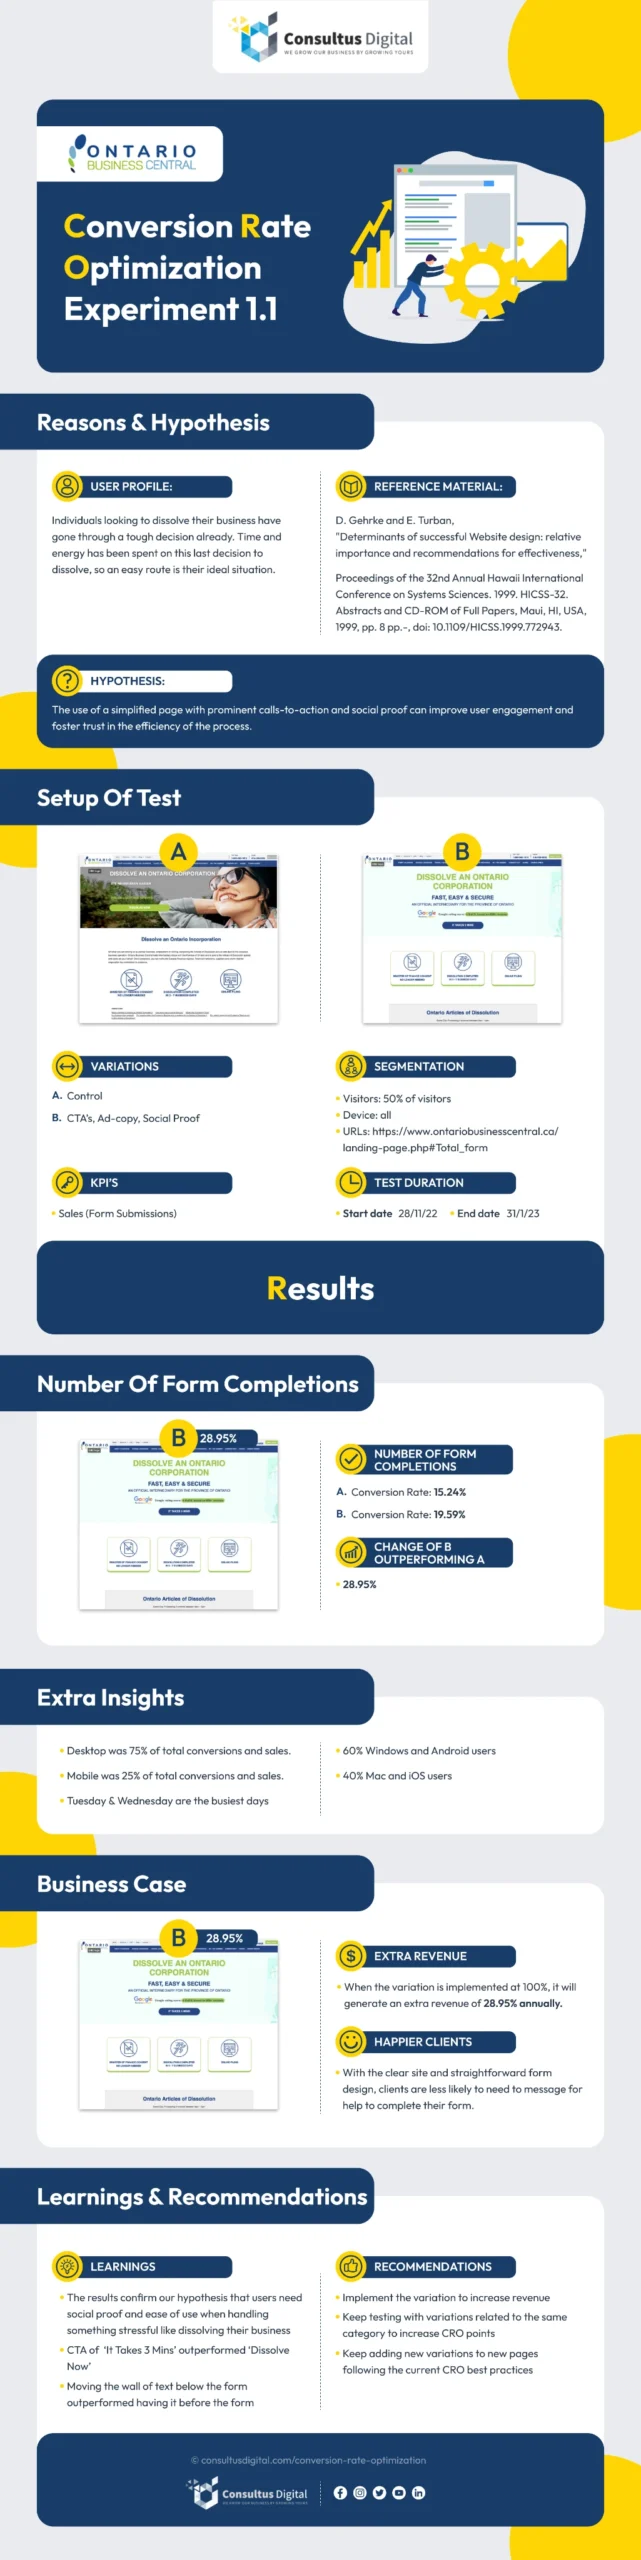
In 2024, Google generated over $264 billion in advertising revenue, solidifying its position as the world’s leading digital advertising platform. This figure surpasses the GDP of many countries, underscoring just how much businesses are willing to spend to reach customers at the exact moment they’re ready to engage.
For small businesses, managing an effective ad campaign through Google Ads offers, whether you’re launching a new search advertising campaign or optimizing an existing one, a powerful avenue to gain visibility and compete with larger brands—but success hinges on effective campaign management. Understanding industry benchmarks is crucial to ensure your advertising efforts are both efficient and impactful. Additionally, advertising costs are a significant factor for small businesses using Google Ads. Understanding these costs, including CPC and cost per lead, can help in optimizing their ad spend and managing overall advertising expenses.
What You’ll Learn in This Article
By reading on, you’ll discover:
- How to interpret industry average CTR, CPC, CPA, conversion rate, ROAS)
- What “good” performance looks like across industries for small businesses
- Which campaign types best match different goals and budgets
- Simple audit steps and budget-planning tactics to keep your ads competitive
- How to monitor and improve your Google Ads account performance through regular audits and industry benchmarks
Key Takeaways
- Benchmarks as a North Star: Use industry medians for CTR, CPC, CPA and conversion rate to gauge whether your campaigns are performing above or below market norms.
- Tight Budget, Big Impact: Small businesses can compete with larger brands by focusing on targeted keywords, geo-focused campaigns, and continuous Quality Score improvements to lower costs.
- Metric Definitions Matter: Know your CTR, CPC, CPA, conversion rate and ROAS inside out—each tells a different story about relevance, cost efficiency, and overall ROI.
- Industry Nuances:
- Legal & Insurance: High CPC/CPA but strong conversion rates—invest in hyper-local keywords and optimized landing pages.
- Home Services & Plumbing: High-intent, mobile searches convert best—leverage emergency and “near me” keywords.
- E-commerce & Apparel: Lower CPCs, lower conversion rates—focus on ad creative and retargeting to lift performance.
- Campaign Type Alignment: Match your goal to the right format: Search for direct response, Display for brand awareness, Local Service Ads for per-lead billing, and Performance Max for multi-channel reach.
- Data-Driven Budgeting: Use benchmark medians to set realistic monthly spend ranges (e.g., $500–$1,500 for local campaigns, $2,000+ for competitive verticals).
- Optimization First: When you’re off-benchmark, make small tweaks—tighten ad groups, refine copy, simplify landing pages—before overhauling entire campaigns.
- Regular Audits: Quarterly benchmarking is sufficient for most SMBs; ramp up to monthly checks in fast-moving sectors to stay agile.
- SMART Goals Guided by Benchmarks: Translate medians into Specific, Measurable, Achievable, Relevant, Time-bound targets to drive continuous improvement.
- Action Over Averages: Benchmarks highlight opportunities, focus on outliers in your data and prioritize experiments that can unlock disproportionate gains.
- Understanding CPC Trends: Analyzing CPC trends is crucial for optimizing advertising costs and improving campaign performance. Factors like inflation, competition, and consumer behavior can significantly impact cost per click, making it essential to stay informed and adjust strategies accordingly.
Introduction to Google Ads
As the world’s most-used search engine, Google drives billions of queries per day—making Google Ads your ticket to serving relevant ads at the very moment users are seeking solutions. Google Ads is a powerful platform for businesses to reach their target audience and drive conversions. By leveraging Google Ads, advertisers can create highly targeted campaigns that reach users based on specific keywords, browsing behaviors, and interests. This precision targeting makes Google Ads an invaluable tool for businesses looking to maximize their online visibility and engagement.
Understanding Google Ads industry benchmarks is crucial for evaluating campaign performance and guiding optimization efforts. These benchmarks provide essential data points, such as average click-through rates (CTR), cost-per-click (CPC), and conversion rates, which help businesses gauge their performance against industry standards. By analyzing these metrics, businesses can set realistic goals, identify areas for improvement, and optimize their campaigns for better results.
In essence, Google Ads benchmarks serve as a roadmap for businesses, offering actionable insights that can lead to more effective and efficient advertising strategies. Whether you’re new to Google Ads or looking to refine your existing campaigns, understanding these benchmarks is key to achieving sustained success.
What Google Ads Benchmarks Mean for Small Businesses
Google Ads benchmarks represent average performance metrics across campaigns in different industries —data you can pull directly from your Google Ads account to see where you stand. These indicators give you a point of comparison—helping you evaluate whether your campaign is competitive or underperforming.
For small businesses, benchmarks matter even more. Budgets are tight. Resources are limited. And in many cases, campaigns are managed in-house by someone juggling multiple roles.
That’s why having reliable industry averages at your fingertips isn’t just useful—it’s essential. They help you spot what’s working, uncover what’s not, and decide where to adjust your strategy or spend. Optimizing your Google Ads account based on industry benchmarks ensures your campaigns are competitive and tailored to yield the best results.
Key Google Ads Metrics to Track
Before we dive into actual benchmarks, let’s quickly break down the core metrics you’ll be comparing. Knowing what each number means—and why it matters—makes the data far more actionable.
- Click-Through Rate (CTR): The percentage of users who click your ad after seeing it. Understanding the average CTR for your industry can help you gauge the effectiveness of your ad copy and targeting. Higher CTR typically means your ad is relevant and compelling.
- Cost-Per-Click (CPC): The average amount you pay for a click. Lower CPC helps stretch your ad budget further.
- Conversion Rate: The percentage of clicks that lead to a meaningful action (e.g., contact form, purchase, booking).
- Cost-Per-Acquisition (CPA): How much it costs you, on average, to gain a customer or lead.
- Return on Ad Spend (ROAS): The revenue generated for every dollar spent on Google Ads. A ROAS of 4 means you’re earning $4 for every $1 spent.
Now that you know what these metrics mean, let’s look at how they perform across industries, and what small businesses can take away from the data.
Understanding Average Google Ads Cost
Understanding the average cost of Google Ads is essential for small businesses aiming to create a cost-effective advertising strategy. Google Ads costs can vary widely depending on several factors, including industry, location, and ad targeting. Typically, these costs are measured by metrics such as cost per click (CPC) and cost per acquisition (CPA).
On average, the CPC for Google Ads is around $2.69, while the average CPA hovers around $45.27. However, these figures can fluctuate significantly based on industry competition. For instance, the industry average CPC can range from as low as $0.50 to over $10. High-competition sectors like legal services often see higher CPCs, whereas less competitive industries may enjoy lower costs.
Several factors influence the average Google Ads cost. Ad relevance and landing page quality play crucial roles in determining your CPC. Google rewards ads that are highly relevant to users with lower costs, making it vital to ensure your ad copy and landing pages are well-optimized. Additionally, your bidding strategies can impact costs. Automated bidding strategies, for example, can help manage your budget more effectively by adjusting bids based on performance data.
Device type also affects costs. Generally, mobile devices tend to have lower CPCs compared to desktop devices. Moreover, the time of day and day of the week can influence the average cost per click, with some periods being more competitive than others.
Industry benchmarks are invaluable for understanding the average cost of Google Ads in your specific sector. By comparing your costs to these benchmarks, you can identify areas where you might be overspending and adjust your strategy accordingly. Regularly monitoring and optimizing your Google Ads campaigns is crucial for reducing costs and improving your return on investment (ROI). This involves continuously refining your ad copy, targeting, and bidding strategies to ensure you’re getting the most out of every dollar spent.
In summary, understanding and managing the average cost of Google Ads is key to developing a cost-effective advertising strategy. By leveraging industry benchmarks and continuously optimizing your campaigns, you can achieve better performance and maximize your advertising budget.
Google Ads Benchmarks by Industry
These search ads benchmarks are sourced from AgencyAnalytics, based on data from over 150,000 Google Ads campaigns. We’ve focused on industries where small businesses are especially active—either because they’re highly competitive or rely heavily on digital visibility to attract customers. These numbers are here to help you assess how your current performance stacks up, and where there may be room to improve.
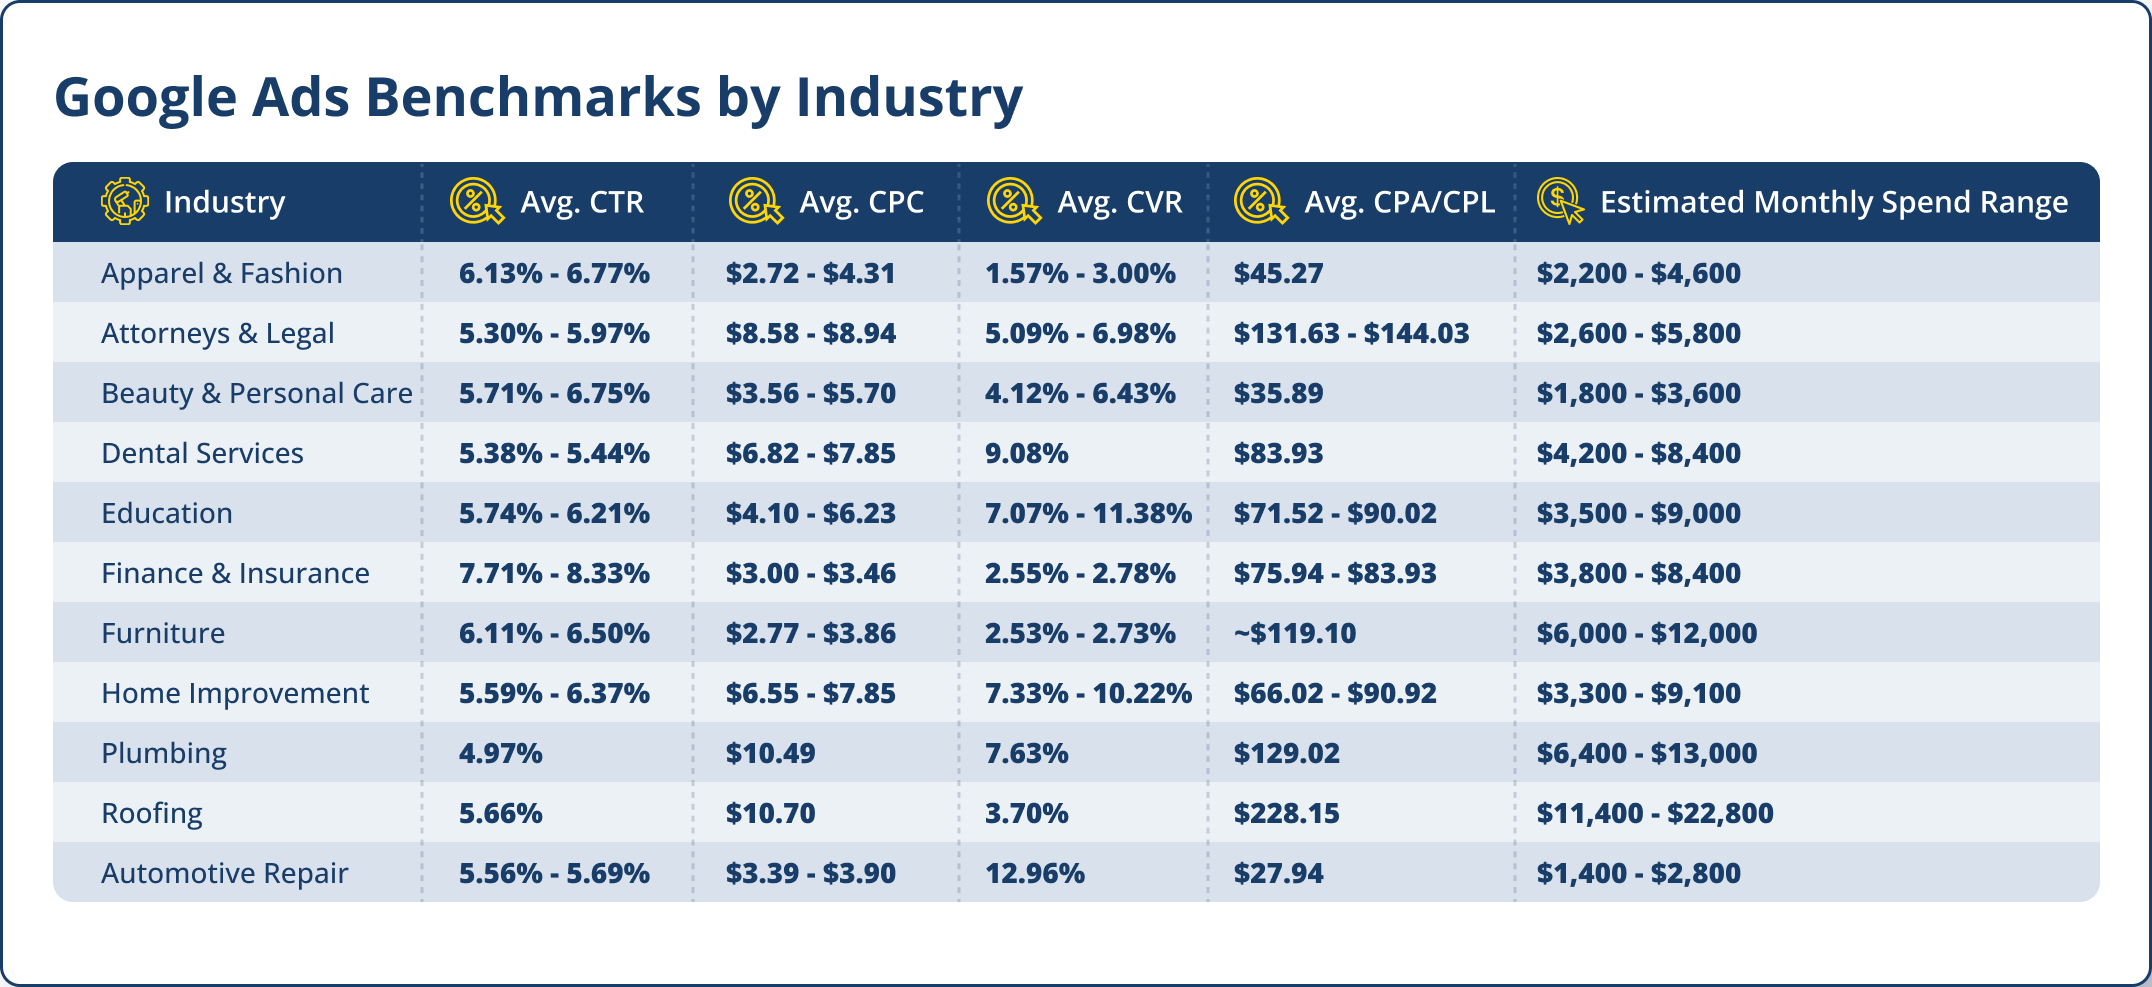
Understanding the industry average CPA can help businesses set realistic expectations and optimize their campaigns for better cost efficiency.
A Note on ROAS Benchmarks: Calculating average ROAS by industry is uniquely challenging. As WebFX explains, few businesses publicly share both their ad spend and resulting revenue, making broad ROAS benchmarks unreliable. While a general ROAS of 200% (or 2:1) is commonly cited, small businesses should track their own return internally to get the clearest picture of performance.
Industry Takeaways from Google Ads Benchmarks
Legal: With a high average CPC of $4.96 and a CPA over $60, legal is among the most competitive verticals. But that’s balanced by a strong 9% conversion rate. For law firms with well-optimized landing pages and localized keyword strategies, Google Ads can deliver qualified leads—if they’re willing to invest.
Education: At a relatively modest CPC of $1.39 and conversion rate of 3.59%, education campaigns benefit from clear value messaging and calls-to-action. This sector often performs best when ads promote specific programs or local opportunities.
Home Improvement: Averaging a CPA of $50 and CPC of $1.74, this category reflects solid ROI potential. Contractors and renovation professionals can succeed with tightly geo-targeted campaigns and service-specific keywords.
Beauty & Personal Care: With a CTR of 4.58% and CPA just under $24, this category often performs well when ads include seasonal promotions, clear visual appeal, or local convenience factors.
Plumbing: This high-intent service category boasts strong numbers: an 8.19% conversion rate and $55 CPA. Emergency keywords like “24/7 plumber near me” tend to convert quickly, especially on mobile.
These insights provide more than just data—they offer a snapshot of how businesses like yours can succeed when benchmarks guide both strategy and spend.
Choosing the Right Google Ads Campaign Type for Small Business
Benchmarks are only part of the equation, what really determines your success is how you apply your budget across the right campaign types. For small businesses, not all Google Ads formats are created equal. Here’s a quick breakdown of common campaign types and how they fit different business goals:
Search Campaigns: These are the most direct. Your ad shows when someone searches for a keyword you’ve targeted. They’re ideal for high-intent actions like “emergency plumbing service” or “buy running shoes online.”
Display Ads (via Google Display Network): These display ads appear across Google Display Network, including blogs, news sites, and YouTube. While they’re not as intent-driven as search, they’re excellent for brand awareness and retargeting.
Local Services Ads: Available for specific industries (like law, HVAC, and cleaning services), these show above traditional search ads and only charge per lead—not per click. They’re ideal for service-area businesses.
Performance Max: This newer campaign type uses AI to serve ads across all of Google’s platforms—from YouTube to Gmail. It’s great for businesses with multiple goals (like calls, store visits, and form fills), but it requires solid conversion tracking to work well.
Choosing the right campaign type is about matching format to intent. High-CPC industries like legal may benefit from Local Services Ads, while e-commerce businesses may rely on a mix of Performance Max and traditional Search. Tailoring your Google Ads strategy to match your business goals and industry benchmarks is crucial for maximizing campaign efficiency.
Once you’ve chosen the right campaign type, the next step is understanding how much you might need to spend—and that’s where industry benchmarks come into play.
Ad Spend Optimization
Ad spend optimization is crucial for maximizing the return on investment (ROI) of Google Ads campaigns. By carefully analyzing industry average CPC, average conversion rates, and cost per acquisition (CPA), businesses can pinpoint areas where they can optimize their ad spend for a more reasonable cost and better efficiency.
For instance, if the industry average CPC for a particular keyword is $5, but your business is paying $10, it may be time to reassess your bidding strategy. This could involve refining your keyword targeting, improving your Quality Score, or adjusting your bid amounts to reduce costs without sacrificing visibility. Google Ads benchmarks provide a valuable reference point, helping you understand where your spending might be out of line with industry norms.
Additionally, these benchmarks can guide you in determining the optimal ad spend for your campaigns. By aligning your budget with industry standards, you can ensure that your ad spend is both competitive and cost-effective. This strategic allocation of resources not only helps in achieving better campaign performance but also in maximizing the impact of every dollar spent.
In summary, ad spend optimization, guided by Google Ads benchmarks, enables businesses to make informed decisions that enhance their advertising efficiency and ROI. By continuously monitoring and adjusting your ad spend, you can stay competitive and achieve your marketing goals more effectively.
How Benchmarks Help You Plan a Google Ads Budget
The benchmarks above don’t just reflect performance, they also hint at how much you might need to invest to reach similar results. Since these figures represent median values, they provide a grounded snapshot of typical performance across industries. For example, industries with higher median CPCs and CPAs, like legal or roofing, often require larger monthly budgets to stay competitive and consistently generate conversions.
If you’re in a vertical with relatively low CPCs—like apparel or education—you may be able to see traction with more modest budgets. In general:
- Local campaigns can often begin with $500–$1,500/month
- More competitive industries typically require $2,000/month or more
Search advertising benchmarks provide valuable insights into typical performance and budget requirements, helping businesses plan their ad spend more effectively. Benchmarks give you a grounded view of what it may take to achieve your goals—and whether your current ad spend aligns with real-world outcomes. A 2025 survey by WebFX reinforces this perspective, reporting that 61% of businesses pay between $0.11 and $0.50 per click, and that most small businesses fall within a $100 to $10,000 monthly ad spend range. These figures closely mirror the benchmark data shown above and highlight how industry-specific context can help guide smarter, more strategic budgeting decisions.
Conversion Rate Optimization
Conversion rate optimization is a critical aspect of Google Ads campaigns, directly impacting the effectiveness and profitability of your advertising efforts. By analyzing average conversion rates, businesses can identify areas where they can improve their campaigns to drive more conversions and achieve better results.
For example, if the average conversion rate for a particular campaign is 2%, but the industry average is 5%, it indicates a significant opportunity for improvement. This could involve optimizing your landing pages to ensure they are user-friendly, mobile-responsive, and aligned with the intent of your ads. Additionally, refining your ad copy to make it more compelling and relevant can also boost conversion rates.
Google Ads benchmarks provide valuable insights into conversion rates, allowing businesses to set realistic goals and measure their performance against industry standards. By understanding where you stand in comparison to these benchmarks, you can make data-driven decisions to enhance your campaigns.
Practical steps for conversion rate optimization include A/B testing different versions of your landing pages and ad copy, simplifying forms to reduce friction, and ensuring a clear and compelling call-to-action, such as a form fill. By continuously testing and refining these elements, you can improve your conversion rates and achieve better overall campaign performance.
In conclusion, conversion rate optimization, guided by Google Ads benchmarks, is essential for maximizing the effectiveness of your advertising efforts. By focusing on continuous improvement and leveraging industry insights, businesses can drive more conversions and achieve their marketing objectives more efficiently.
Beyond Benchmarks: What Impacts Your Real Ad Costs
While industry benchmarks provide helpful context, they don’t explain everything—especially why your campaign may cost more (or less) than the averages suggest.
Google Ads uses a real-time auction system to determine which ads get shown, where they appear, and how much you actually pay. Your cost isn’t just about how much you bid—it’s also shaped by how relevant and high-quality Google thinks your ad is, and understanding the lifetime value of your customers.
At the heart of this system is something called Ad Rank, which is influenced by:
- Your maximum bid (what you’re willing to pay)
- Your Quality Score (how relevant and useful your ad and landing page are)
- Expected performance signals, like click-through rate
[Ad Rank Formula Image]
Even in high-CPC industries like legal or insurance, small businesses can gain an edge by improving their Quality Score. Strong, relevant ad copy and well-matched landing pages don’t just improve performance, they can actually bring your costs down by making your ad more competitive in the auction.
Understanding what impacts your results is one thing, now it’s time to step back and assess how your campaigns are actually performing against industry standards.
How to Use These Benchmarks to Audit Your Campaign
Knowing how your performance stacks up against industry medians is the first step: but the real value comes from interpreting why your numbers are above or below those benchmarks.
Start by pulling your last 30 days of campaign performance: CTR, CPC, CPA, and conversion rate, and compare those numbers to the median figures in your industry. Auditing your search ad performance against industry benchmarks can help identify areas for improvement and optimization.
Are you paying significantly more per click than others in your category? That could be a sign of low ad relevance or a poor Quality Score. Is your conversion rate lagging behind the benchmark? Your landing page might not match the intent of your ad, or your form could be asking too much too soon.
Benchmarks aren’t there to make you chase averages. They help you spot outliers. And those outliers are often where the best optimization opportunities live.
You don’t need to overhaul your entire account. Often, small changes, testing stronger headlines, tightening targeting, simplifying your landing page, can unlock measurable gains in efficiency and ROI.
From Audit to Action: Setting Smarter Google Ads Goals
Once you understand how your performance compares to industry benchmarks, the next step is setting realistic, data-informed goals for your campaigns. Benchmarks aren’t just for diagnostics, they can guide planning, budgeting, and team alignment.
Start by identifying your primary objective. Are you aiming for more leads? Lower acquisition cost? Higher revenue per click? Understanding how many ad clicks successfully lead to conversions can guide your goal-setting process. Benchmarks offer a useful reality check to ensure those goals are ambitious but attainable.
For example, if the average conversion rate in your industry is 4%, a short-term goal of reaching 3.5% might be more practical than shooting straight for 7%. If your current CPA is $90 in a category where the median is $55, then your goal could focus on reducing CPA by 20–30% through ad relevance and landing page updates. Setting goals based on key metrics like costs per click (CPC) and costs per acquisition (CPA) can help in achieving more targeted and efficient advertising outcomes.
Make sure your goals follow the SMART framework:
- Specific: “Increase CTR to 3.5% on Search campaigns.”
- Measurable: “Reduce CPC from $3.00 to $2.50.”
- Achievable: Based on your past 90-day trend.
- Relevant: Tied to your most profitable services or products.
- Time-bound: “Within the next 60 days.”
Benchmarks help ground these targets in the reality of what similar advertisers are achieving. That means fewer guesses, fewer wasted clicks, and a much clearer path to measurable growth.
What to Do If You're Falling Below the Benchmark
Not every campaign hits the benchmark right away, and that’s okay. The real value comes from knowing where you’re underperforming and taking targeted steps to improve. Adopting a data-driven approach is crucial for identifying these areas and making informed decisions to optimize your campaign.
Here’s how to approach each of the four core metrics:
- High CPC: Focus on improving ad relevance and Quality Score. Use tightly themed ad groups, refine your keywords, and make sure your ad copy aligns with search intent.
- Low CTR: Revisit your headlines and descriptions. Are they clear? Do they highlight a compelling value or unique selling point? Consider adding sitelinks, callouts, or structured snippets.
- Low Conversion Rate: Look beyond the ad itself. Is your landing page mobile-friendly? Fast-loading? Focused on one goal? Simplifying forms or offering clearer next steps can make a big difference.
- High CPA: Start by breaking down where costs are accumulating and aim for the lowest cost per acquisition. It may be a targeting issue (too broad), a bidding strategy mismatch, or a weak conversion funnel.
Small changes, tested thoughtfully, can lead to meaningful gains; and over time, bring your metrics in line with (or even above) industry benchmarks.
How Often Should You Benchmark Your Google Ads Performance?
Benchmarking isn’t a one-and-done exercise. To keep your campaigns performing at a high level, it’s smart to compare your metrics to industry benchmarks on a regular basis, especially when running search advertising. Regularly tracking average CTRs can help in maintaining and improving ad performance over time. But how often is enough?
For most small businesses, quarterly benchmarking strikes the right balance. It allows you to track progress, adjust for seasonality, and identify trends without overreacting to short-term fluctuations. If you’re running high-budget or fast-changing campaigns—especially in competitive industries like legal, home services, or ecommerce—monthly benchmarking may be more appropriate.
Remember: the goal of benchmarking is not to chase perfect numbers, but to stay grounded in what’s normal for your space, and act decisively when your results fall outside those norms.
What You Do Next Matters Most
Benchmarks aren’t just industry stats, they’re your starting point for smarter strategy. They help you set expectations, uncover weaknesses, and guide optimization efforts without guessing. Effectively interpreting these benchmarks can transform generic data into a competitive advantage by guiding more informed and strategic decisions. Whether you’re managing campaigns yourself or working with a partner, using data like this keeps your decisions grounded and your budget working harder.
If you’re unsure whether your campaigns are hitting the mark—or you’re ready to scale with more confidence—our team can help. Contact us to get a data-backed review of your current strategy and uncover opportunities for growth.
Recommended Articles

This Month's Strategy Can Define Your Year - Don't Miss Out!

4.9 stars from 43 entrepreneurs

 416-460-1810